
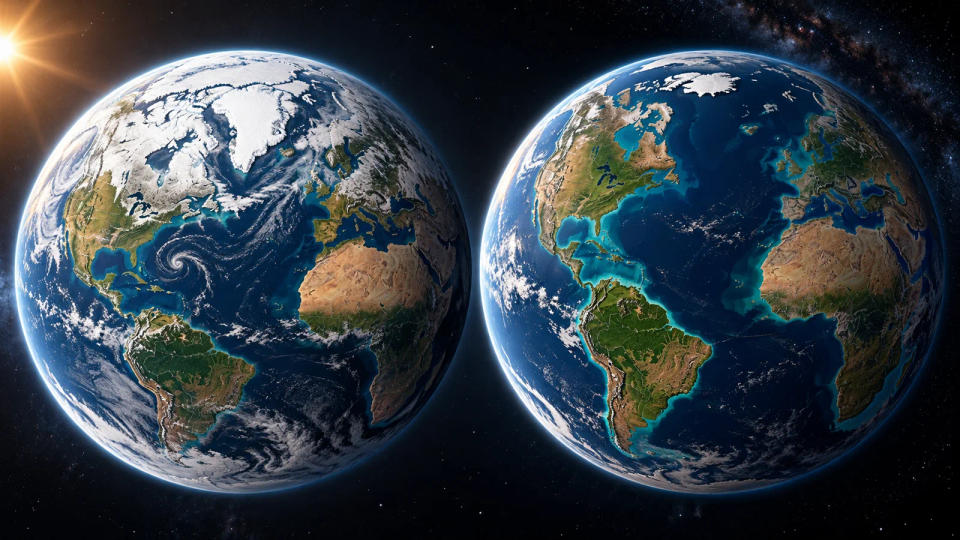
What if every last glacier and ice sheet on land melted and its water reached the oceans? The familiar outline of our world map would change dramatically: the global mean sea level would rise by roughly 70 meters, or 230 feet, according to the U.S. Geological Survey. That is not a forecast of an imminent flood. It is a thought experiment showing just how much water is locked away on land.
Picture opening an atlas and finding that some wide coastal plains have become bays, river deltas have retreated inland, and small low-lying islands are harder to locate. Mountain ranges would still stand tall. The surprising change is not that continents disappear, but that the fine, human-inhabited edges of continents are redrawn. And even this imagined map is more complicated than simply drawing a uniform blue line 70 meters higher everywhere.
Why Melting Land Ice Raises the Sea
To understand the number, first separate two kinds of ice. Sea ice, such as floating Arctic pack ice, already displaces seawater. When it melts, it produces little direct change in sea level, much as an ice cube melting in a full glass does not suddenly raise the water beyond the level displaced while it floated. Land ice is different. Snow accumulates over land, compresses into glaciers or huge ice sheets, and becomes a water store above the ocean. Once that ice melts and flows into the sea, it adds new water.
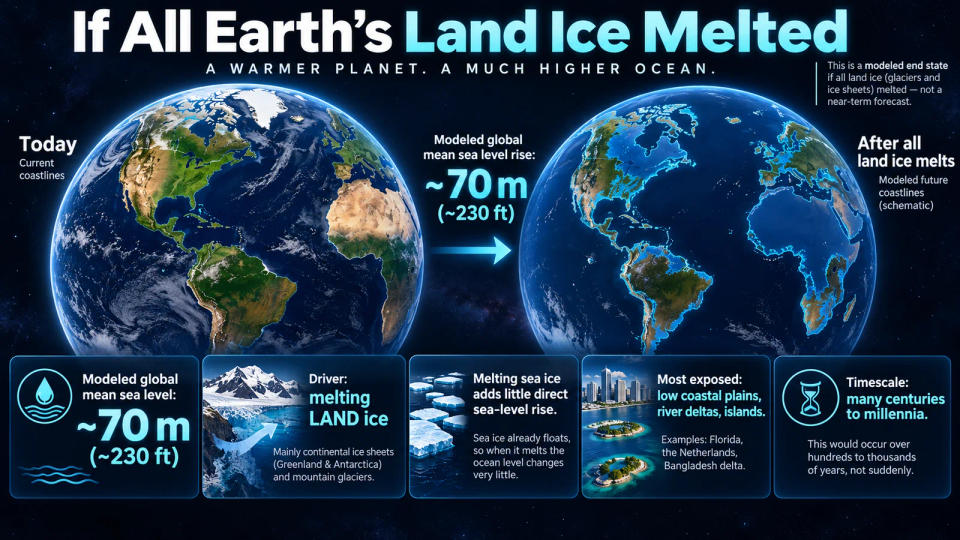
The biggest stores are Antarctica and Greenland, with smaller contributions from mountain glaciers scattered across the planet. NASA estimates that Greenland's ice sheet alone could add about seven meters to global sea level if it vanished completely. The USGS gives a rounded total of about 70 meters for all the world's glaciers and ice sheets combined, while emphasizing uncertainty about their full ice volume. The figure is a potential total, not the rise expected in any particular decade.
There is another process happening in the real world: warming seawater expands. A warmer ocean takes up more space even without an extra drop from melted ice. In a scenario where all land ice is gone, ocean temperature, currents and changes in Earth's shape would influence the exact waterline. A crisp future coastline in an illustration is therefore best read as a schematic, not a property-level elevation survey.
Which Parts of the World Map Would Change Most?
A simple mental map begins with low elevation. The southern Florida peninsula would be extremely vulnerable, as would many parts of the Gulf and Atlantic coastal plains. In Europe, the Netherlands and other low-lying North Sea coastlands would require a radically different relationship with the water. In South Asia, densely settled delta regions, including the Ganges–Brahmaputra–Meghna delta in Bangladesh, stand out because broad terrain lies close to today's sea level.
Deltas are vulnerable for more than one reason. Rivers carry sediment to a coast and build a broad, gently sloping landscape. That fertile land supports cities, farming and ports, yet its low height makes even a relatively modest rise consequential. In the all-ice-melt thought experiment, such regions would be dramatically reshaped. Estuaries could reach farther upstream, some islands would be inundated, and coastlines would move around the base of higher ground.
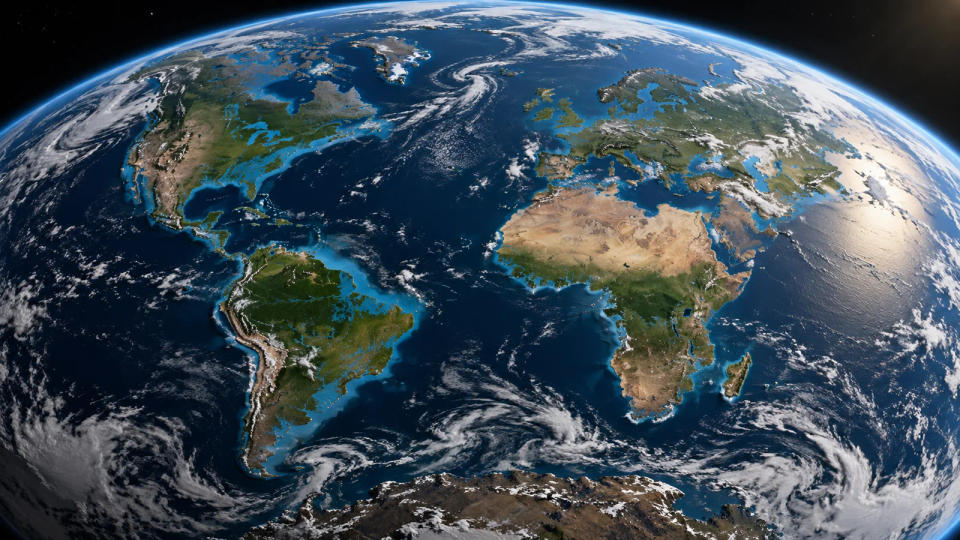
Higher terrain tells a different story. The Andes, the Himalayas, the Alps and other mountain systems would remain well above the sea. An exaggerated picture that turns most of a continent into ocean would be misleading. The outcome is better thought of as a planet retaining its large landmasses while losing or transforming many of its coastal margins.
Importantly, a global average rise is not a guaranteed 70-meter increase at each shore. NASA explains that ice loss alters the gravitational pull of ice sheets, the deformation of Earth's crust and the planet's rotation. Ocean circulation and sinking or rising land add further differences. These regional patterns are sometimes called sea-level fingerprints. So a generic color-coded flood map cannot reliably predict which block of a city would remain dry under this extreme scenario.
What Scientists Can Actually Measure Today
The 70-meter scenario is hypothetical, but present-day sea-level rise is measured, not imaginary. NASA tracks global mean sea level with satellite altimeters and describes a long-term upward trend driven mainly by melting land ice and the thermal expansion of seawater. The satellite record is invaluable because it measures the entire ocean rather than one tide gauge near a single coastline.
Meanwhile, NASA's GRACE and GRACE Follow-On missions measure changes in Earth's gravity field. These observations help researchers estimate how much mass the Greenland and Antarctic ice sheets gain or lose. They do not show all ice disappearing; they reveal ongoing losses that scientists can test against climate and ice-flow models. That distinction matters: measurements tell us what has happened, while simulations explore possible futures under stated assumptions.
Scientists also look below the ice. At the coast of Antarctica, ice can flow from bedrock into floating ice shelves. Those shelves act as buttresses that slow the land-based ice behind them. If warm seawater thins the shelves, the inland ice may flow faster toward the ocean. South Korea's Korea Polar Research Institute has highlighted missing observations beneath Antarctic coastal ice and their consequences for the uncertainty of sea-level predictions. This is a reminder that better measurements, not just dramatic images, make future maps more useful.
Nor does complete melting have a single agreed date. Major ice sheets react over very long timescales and can keep adjusting long after a warming episode. The hypothetical end state would involve many centuries to millennia or longer depending on climate conditions and ice-sheet responses. It should not be confused with a sea-level projection for 2050 or 2100.
Conclusion
So how different would the world map be? In the extreme case of all land ice melting, approximately 70 meters of global mean sea-level rise would remake large coastal plains, deltas and islands while leaving most high continental interiors above water. The map in this article is an artistic schematic of that possible end state, not a precise model of every shore.
The practical lesson is about scale and time. Today's observed rise is vastly smaller than the all-ice-melt total, but even much smaller changes affect storm surges, drainage, infrastructure and communities along low coasts. We do not need to wait for all the ice to vanish to understand why the boundaries between land and sea matter.
Sources & Further Reading
- U.S. Geological Survey — How would sea level change if all glaciers melted?
- NASA — Questions (FAQ): Greenland ice and floating sea ice
- NASA — Sea Level (Earth Indicator)
- NASA — Evidence of Sea Level Fingerprints
- Korea Polar Research Institute — Antarctic Coastal Observation Gaps
Post a Comment